Mappable
YHack 2017 Project
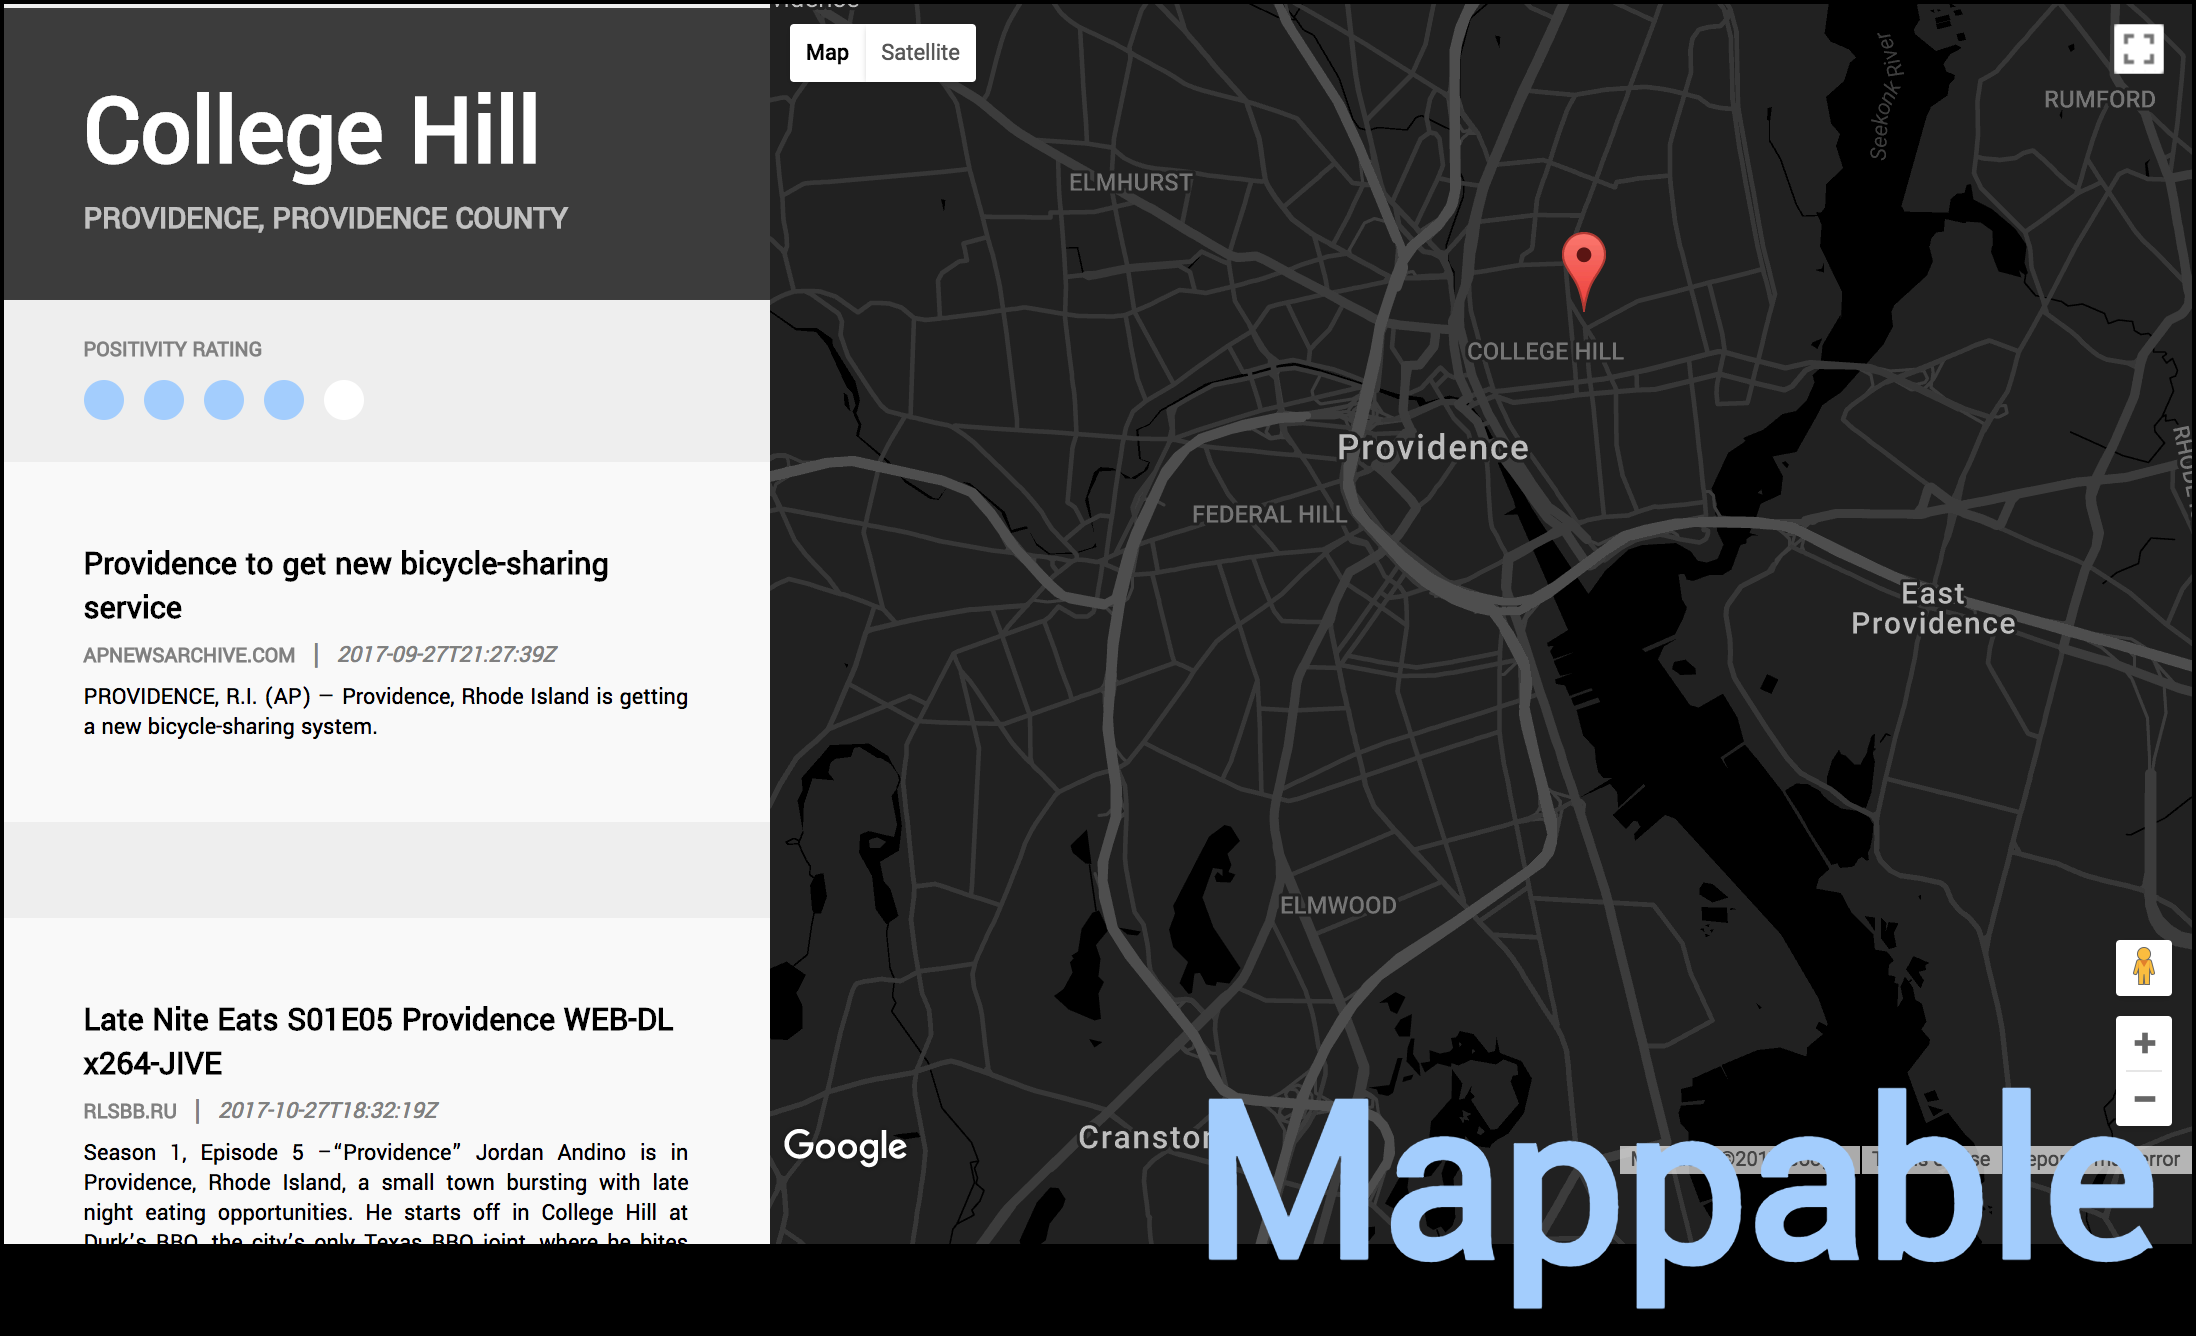
Mappable is a data visualization web application that helps users find location specific data.
Context
At YHack 2017, our team members each had different learning objects, some of us wanted to practice our frontend skills, while some wanted to practice building a backend. We decided that a data visualization tool would require both expertise. We had the goal of collecting data and converting it into metrics, which could then be plotted onto a choropleth map.
Process
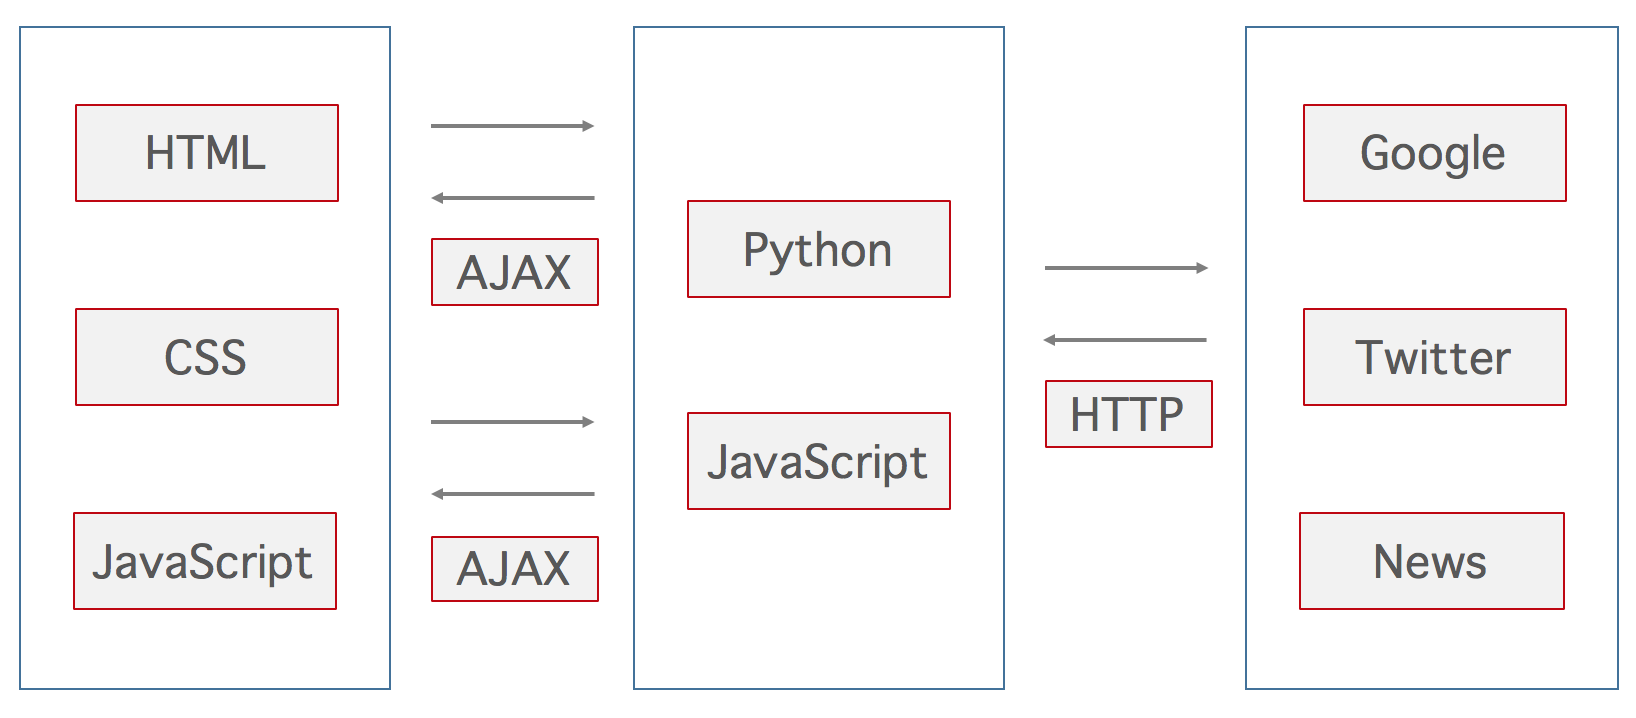
For this project, my learning objective was to practice communicating with APIs, and parsing the incoming information. Thus, my main contribution was the backend of the web app. I used Google Map APIs, Twitter APIs, and NEWS API to accomplish this.
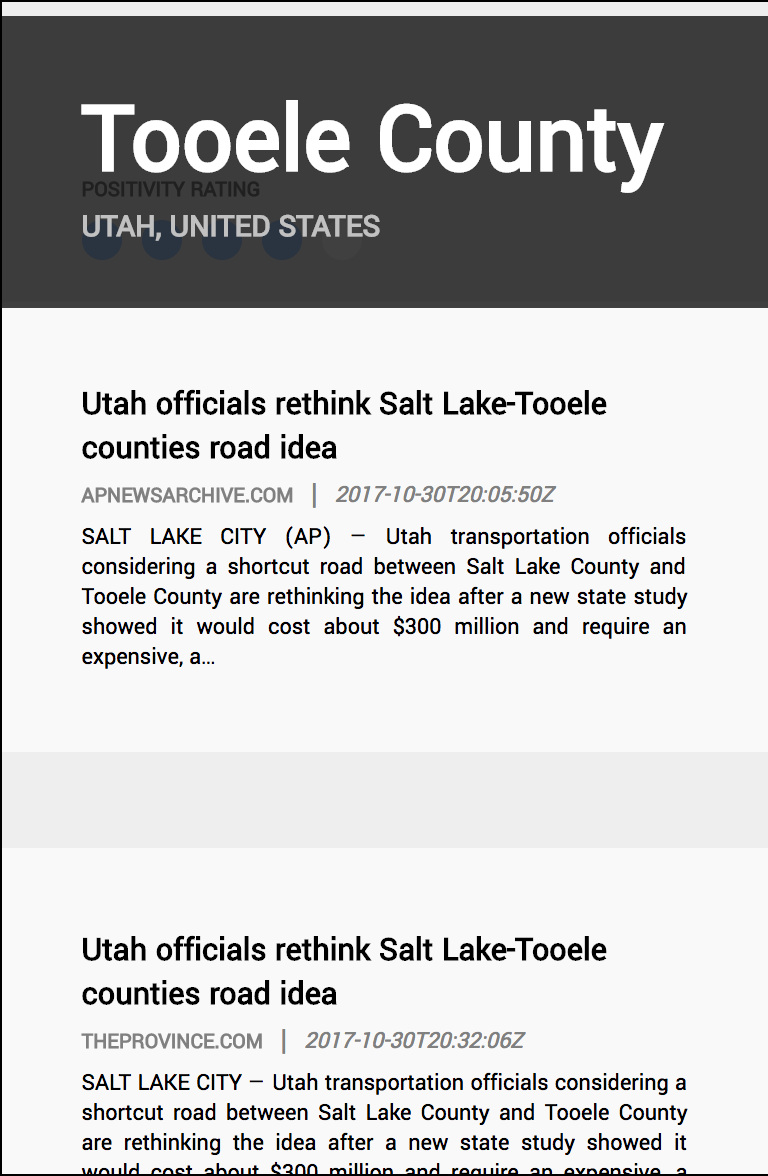
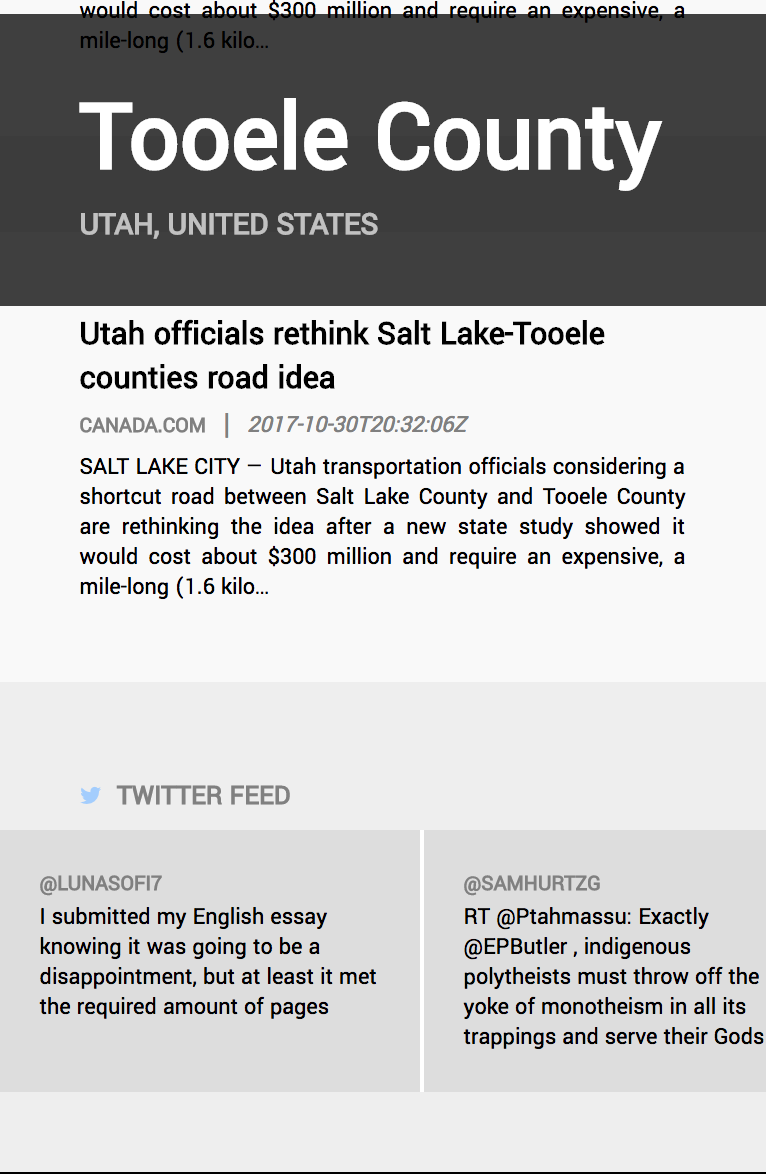
Live news and tweet results from Tooele County
Using latitude and longitude specifying a location, I convert the information into an address using the Google Map APIs. This address could be parsed to search for related news using NEWS API. The latitude and longitude could also be used to search for tweets within a certain region, returning location-specific tweets.
Challenges

One main challenge we faced was trying to host our code online. As we coded mostly in Python, we had to employ several cloud services to deploy our code. We also had trouble communicating between frontend Javascript and backend Python code, despite having deployed our backend. Our solution was to rewrite our backend functions in Javascript. This eliminated the need for a cloud service to host our backend and also bridged the communcation gap between and front and backend.
Conclusion
Our team was extremely excited to complete a working hack. I learned a lot more about Javascript. For example, I learned that hosting Javascript code on a webpage itself posed severe security risks as it exposes source code to users.
More Projects